
90896682@N06
タグをコピペすると、ブログなどにカンタン貼り付けできます。
各画像のライセンスに従って利用してください。被写体の肖像権、商標・意匠登録等にご注意ください。
詳しくはクリエイティブ・コモンズ・ライセンスの利用についてをご覧ください。

Ozone Hole Evolution, August 1 through November 30, 2018
by Atmospheric Infrared Sounder
by Atmospheric Infrared Sounder

Locations of Trace Gas Absorption in the AIRS Infrared Radiance Spectrum
by Atmospheric Infrared Sounder
by Atmospheric Infrared Sounder

NASA’s AIRS Sees Formation of Ozone Hole Over South Pole, August 1 through November 23, 2016
by Atmospheric Infrared Sounder
by Atmospheric Infrared Sounder

Ozone hole formation over south pole, September 1 to December 4, 2014
by Atmospheric Infrared Sounder
by Atmospheric Infrared Sounder

Carbon Monoxide in Mid-Troposphere over Indonesia Fires, October 26-28, 2015
by Atmospheric Infrared Sounder
by Atmospheric Infrared Sounder

Carbon Monoxide in Mid-Troposphere over Indonesia Fires, October 14-16, 2015
by Atmospheric Infrared Sounder
by Atmospheric Infrared Sounder


Poster: AIRS Monitoring Earth's Atmosphere
by Atmospheric Infrared Sounder
by Atmospheric Infrared Sounder

NASA's AIRS Sees Rivers of Rain for California
by Atmospheric Infrared Sounder
by Atmospheric Infrared Sounder

Temperature Anomaly corresponding to January 2014 Polar Vortex Activity
by Atmospheric Infrared Sounder
by Atmospheric Infrared Sounder

NASA's AIRS Sees Polar Vortex Behind U.S. Big Chill (narrated)
by Atmospheric Infrared Sounder
by Atmospheric Infrared Sounder

NASA's AIRS Sees Polar Vortex Behind U.S. Big Chill
by Atmospheric Infrared Sounder
by Atmospheric Infrared Sounder

Atmospheric Infrared Sounder instrument sections
by Atmospheric Infrared Sounder
by Atmospheric Infrared Sounder

Animation: AIRS Instrument Sees Spread of Pollution from Western Wildfires, August 2013
by Atmospheric Infrared Sounder
by Atmospheric Infrared Sounder

AIRS Images Pollution from California's Rim Fire 2013
by Atmospheric Infrared Sounder
by Atmospheric Infrared Sounder

Concentration of Atmospheric Carbon Dioxide from Earth's Mid-Troposphere, 2002 to 2013
by Atmospheric Infrared Sounder
by Atmospheric Infrared Sounder

Zonally Averaged Carbon Dioxide Concentration from Earth's Mid-Troposphere at Different Latitudes, 2002 to 2013
by Atmospheric Infrared Sounder
by Atmospheric Infrared Sounder

Carbon Dioxide in Earth's Mid-Troposphere, April 2013 Monthly Average
by Atmospheric Infrared Sounder
by Atmospheric Infrared Sounder

NASA Earth satellites currently operating (9/2013)
by Atmospheric Infrared Sounder
by Atmospheric Infrared Sounder

Flooding Resulting From Hurricane Isidore: Difference image, Sept 12 and 28, 2002
by Atmospheric Infrared Sounder
by Atmospheric Infrared Sounder

Flooding Resulting From Hurricane Isidore: Comparing data from Sept 12 and 28, 2002
by Atmospheric Infrared Sounder
by Atmospheric Infrared Sounder

Relative humidity distributions within thin cirrus for several regions and inter-annual variations in the Indian Ocean
by Atmospheric Infrared Sounder
by Atmospheric Infrared Sounder

Joint distributions of thin cirrus properties and relative humidity from AIRS-7
by Atmospheric Infrared Sounder
by Atmospheric Infrared Sounder

Tropical thin cirrus retrievals of particle size and optical depth from AIRS
by Atmospheric Infrared Sounder
by Atmospheric Infrared Sounder

Bias and Variability of CloudSat-AIRS cloud top height differences for V4 and V5
by Atmospheric Infrared Sounder
by Atmospheric Infrared Sounder

CloudSat-AIRS cloud top height differences as a function of AIRS cloud fraction and CloudSat cloud type
by Atmospheric Infrared Sounder
by Atmospheric Infrared Sounder

Zonal Height Cross-Sectional Averages, AIRS, CloudSat, and CALIPSO
by Atmospheric Infrared Sounder
by Atmospheric Infrared Sounder

Zonal Average AIRS Cloud Frequency and Cloud Fraction
by Atmospheric Infrared Sounder
by Atmospheric Infrared Sounder

Vertical Cross-Sections of CloudSat, CALIPSO, and AIRS Cloud Fields
by Atmospheric Infrared Sounder
by Atmospheric Infrared Sounder

Watching Earth Breathe (with narration): The Seasonal Vegetation Cycle and Atmospheric Carbon Dioxide
by Atmospheric Infrared Sounder
by Atmospheric Infrared Sounder


NASA's Aqua satellite in high bay, prepare to hoist
by Atmospheric Infrared Sounder
by Atmospheric Infrared Sounder


Global Carbon Monoxide, August through September 2005
by Atmospheric Infrared Sounder
by Atmospheric Infrared Sounder

Ozone Burden During Antarctic Winter, August through September 2005
by Atmospheric Infrared Sounder
by Atmospheric Infrared Sounder

Carbon Monoxide from California's Wildfires 2008
by Atmospheric Infrared Sounder
by Atmospheric Infrared Sounder


AIRS Collects Data and Creates a Temperature Profile
by Atmospheric Infrared Sounder
by Atmospheric Infrared Sounder


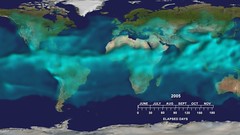
Water Vapor Transport, June through November 2005
by Atmospheric Infrared Sounder
by Atmospheric Infrared Sounder

Sulfur Dioxide from Okmok Volcano, July 2008
by Atmospheric Infrared Sounder
by Atmospheric Infrared Sounder


Water Vapor In Storm Front Near Southern California, January 2003
by Atmospheric Infrared Sounder
by Atmospheric Infrared Sounder

Water Vapor In Storm Front Near Southern California, January 2003
by Atmospheric Infrared Sounder
by Atmospheric Infrared Sounder

Water Vapor In Storm Front Near Southern California, January 2003
by Atmospheric Infrared Sounder
by Atmospheric Infrared Sounder

Carbon Monoxide from Fires in Greece, 2007
by Atmospheric Infrared Sounder
by Atmospheric Infrared Sounder


Global Carbon Dioxide with Winds, July 2003
by Atmospheric Infrared Sounder
by Atmospheric Infrared Sounder

Belt of Carbon Dioxide in Southern Hemisphere, July 2003
by Atmospheric Infrared Sounder
by Atmospheric Infrared Sounder

Belt of Carbon Dioxide in Southern Hemisphere with Winds, July 2003
by Atmospheric Infrared Sounder
by Atmospheric Infrared Sounder
1件~60件 (全 112件)