
Goldstrike Resources (TSX-V:GSR) June 5 2012 Bullish Price Crosses 21 & 50 Day Moving Averages : 無料・フリー素材/写真
Goldstrike Resources (TSX-V:GSR) June 5 2012 Bullish Price Crosses 21 & 50 Day Moving Averages / Chester Yukon Gold
| ライセンス | クリエイティブ・コモンズ 表示 2.1 |
|---|---|
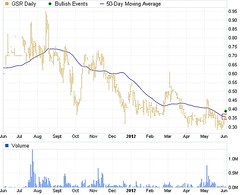
| 説明 | Goldstrike Resources Ltd (GSR:TSXV)Event Details for: MACDThe MACD (Moving Average Convergence Divergence) plots the difference between a shorter-term (12-bar) and a longer-term (26-bar) exponential moving average (EMA). Bullish and bearish events are generated respectively as the MACD fluctuates above and below zero to indicate whether prices in the shorter term are stronger or weaker than the longer term average. A 9-period EMA of the MACD is overlayed as a "signal line" which smooths out the MACD to provide a clearer view of whether it's moving upward or downward. A bullish event is generated when the MACD crosses above the signal line, showing that the current MACD is actually higher than its average, a sign of increasing strength for the price. The opposite is true for bearish events which signal decreasing strength in price as the MACD crosses below the signal line showing that it's now below average. Event Date:Jun 05, 2012Opportunity Type:Short-Term BullishClose Price:$0.37Price Period:DailyVolume:23,100 |
| 撮影日 | 2012-06-06 07:49:30 |
| 撮影者 | Chester Yukon Gold , Whitehorse, Yukon Territory, Canada |
| 撮影地 |